

Canada’s employment declined by 42,000 in August while the unemployment rate stayed at 6.4%, according to Statistics Canada’s September 4 Labour Force Survey release. The participation rate also fell, by 0.1 percentage points to 65.0%. Those results describe different measures of the labour market. Statistics Canada
Employment and unemployment measure different things
Employment is a count of people with work. The unemployment rate expresses unemployed people as a share of the labour force, which comprises employed and unemployed people. A percentage can remain unchanged when both its numerator and denominator change.
A worked example: the same rate, fewer jobs
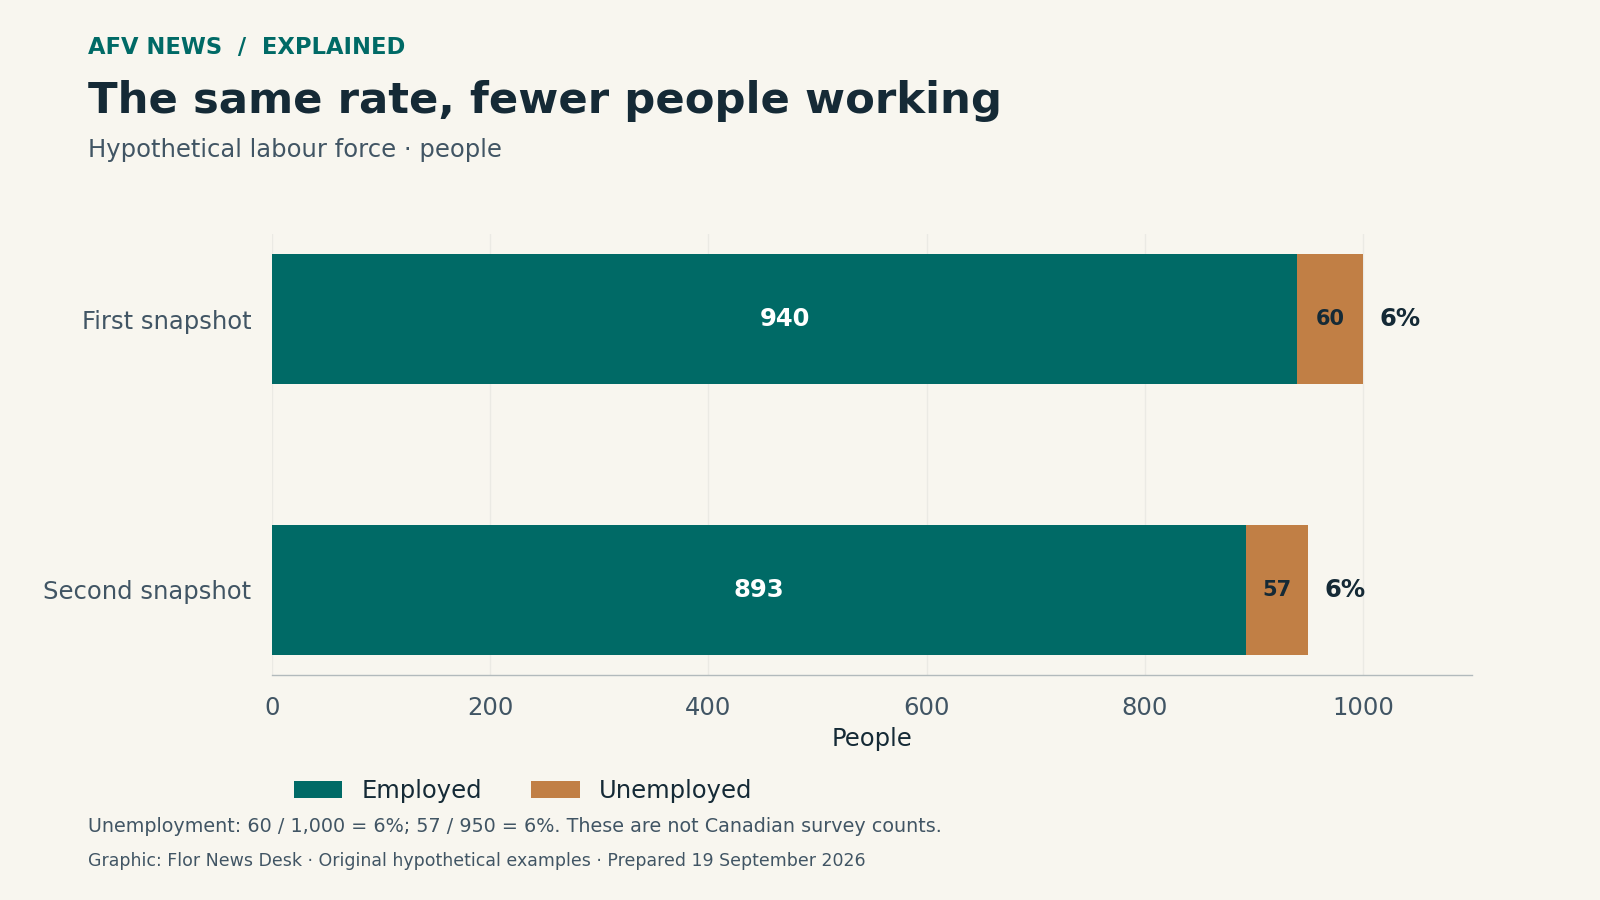
Consider an invented labour force of 1,000 people. If 940 are employed and 60 are unemployed, the unemployment rate is 60 divided by 1,000, or 6%.
In a second snapshot, suppose 893 people are employed and 57 are unemployed. The labour force totals 950. The unemployment rate is 57 divided by 950, also 6%, even though 47 fewer people are employed.
These are hypothetical figures chosen to illustrate the ratio. They are not a reconstruction of Canada’s August results, and they do not identify why any particular person stopped working or left the labour force.
The example also shows why a stable unemployment rate cannot, by itself, establish that employment was stable. It answers a question about a share, not a question about the number working.
What the figures mean for recruitment
For a company preparing a hiring plan, each measure supplies a different piece of context. Employment indicates the number working; participation helps describe how much of the relevant population is in the labour force. Neither national figure directly measures the pool of qualified applicants for a particular role in a particular town.
A planning note should therefore identify its geography, population and comparison period before applying a national headline to recruitment. Its own vacancy records can answer a narrower question: whether the number of suitable applications per opening changed during a specified period. That observation would still need to account for changes in the role, pay offered or advertising.
There is also a timing boundary. These figures concern August and were released on September 4. They should not be presented as a reading of employment conditions on September 19 merely because a briefing is being written then.
Reading the count and the rate together preserves the distinction between a smaller employed population and an unchanged unemployment percentage.
Read our editorial standards or send a correction to the editorial desk.