
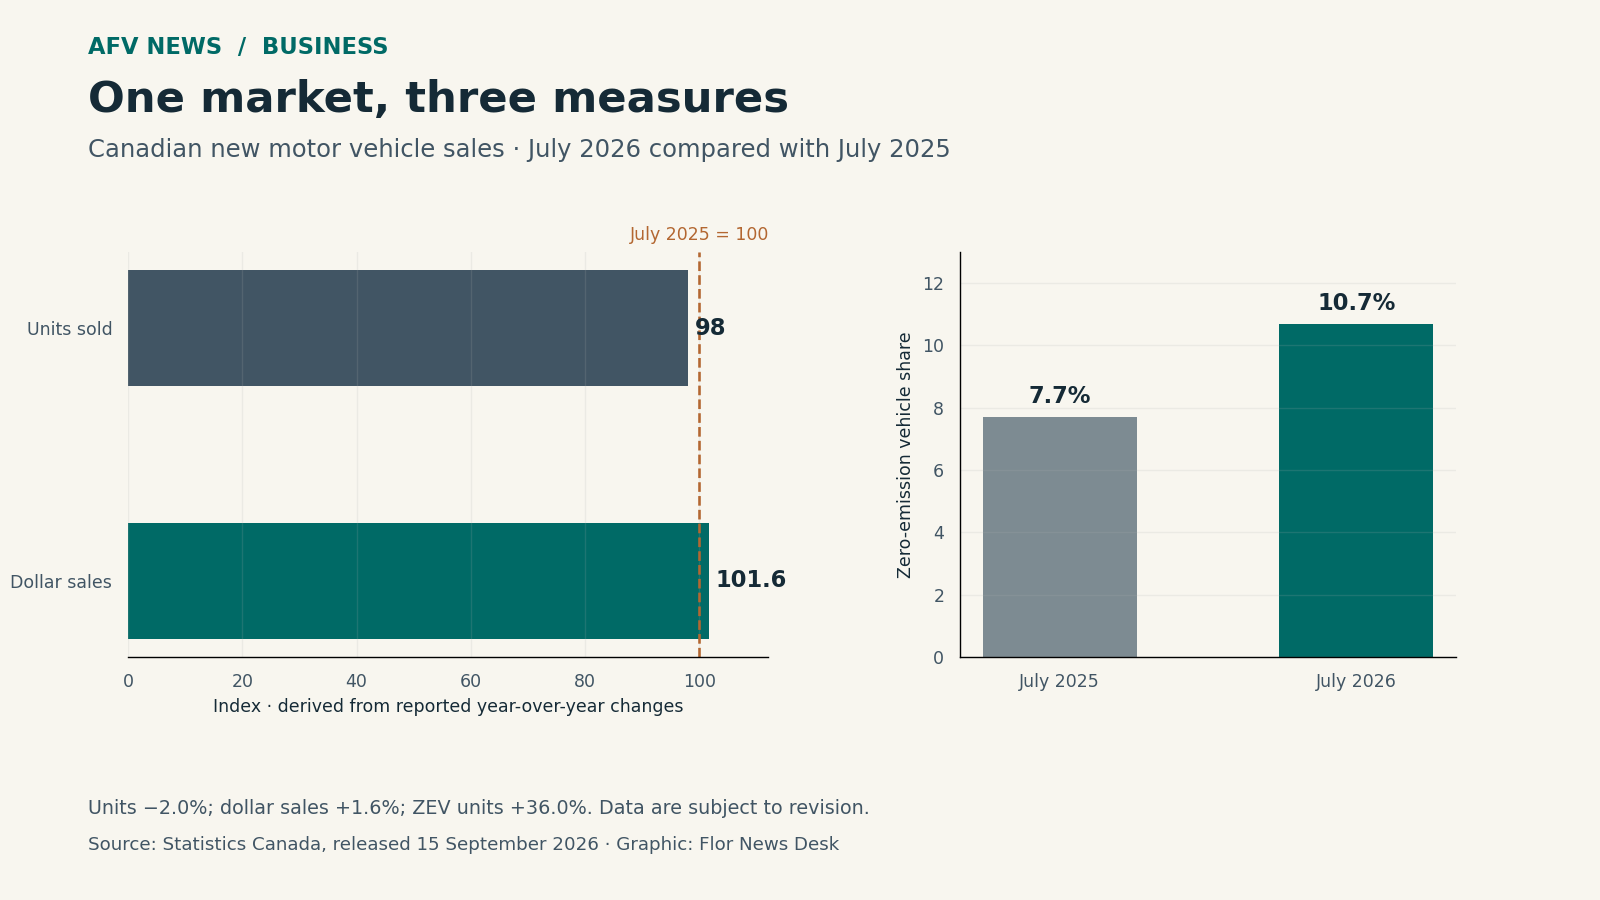
Statistics Canada counted 176,156 new motor vehicles sold in Canada in July 2026. That was 2.0% fewer than in July 2025, while the dollar value of sales rose 1.6%. For a dealer or supplier, those two movements describe different parts of the business. Statistics Canada, released September 15
Why sales value and units can diverge
An index makes the distinction visible. Set July 2025 unit sales and dollar sales to 100. The reported changes put the July 2026 unit index at 98 and the dollar-sales index at 101.6. Dividing the second index by the first produces about 103.7 for dollars per vehicle, an increase of roughly 3.7%.
That calculation is a ratio of two national aggregates. It is not an official vehicle price index, a measure of dealer profit or proof that the price of a like-for-like vehicle rose 3.7%. The ratio can change when buyers choose a different mix of cars and trucks, models or trim levels. It also does not show what happened to discounts, financing income or the cost of inventory.
Zero-emission vehicles and the changing mix
The same release shows why mix deserves its own line in a sales report. Statistics Canada recorded 18,920 new zero-emission vehicles sold in July, 36.0% more than a year earlier. Their share of total new-vehicle sales rose from 7.7% to 10.7%.
The 36.0% increase and the three-percentage-point share gain are related, but they are not interchangeable. Unit growth compares zero-emission vehicle sales with their year-earlier level. Market share compares those sales with all vehicles sold in the same month. Because total vehicle sales declined, the denominator also helped lift the share.
Reading the figures alongside dealership records
A dealership briefing that reports only revenue could therefore miss weaker overall unit demand. A briefing that reports only units could miss a change in the value and composition of what was sold. Neither measure establishes the margin earned on those transactions.
For internal use, the national indicators can sit beside four dealership records: units delivered, sales value before and after discounts, gross profit, and mix by vehicle type. Keeping the measures separate allows managers to see whether a revenue increase came with more vehicles, a different mix or a larger amount per transaction.
Comparisons also need the same time basis. The national figures compare July 2026 with July 2025, not June with July. A dealer comparing its July result with the previous month would be answering a different question and could be affected by normal seasonal patterns.
Statistics Canada notes that the figures are subject to revision. A later operating review should retain the release date and the downloaded values rather than silently combining numbers from different vintages.
The July release does not settle whether the market became more profitable. It does show why sales value, unit demand and vehicle mix belong in the same conversation without being collapsed into one headline.
Read our editorial standards or send a correction to the editorial desk.