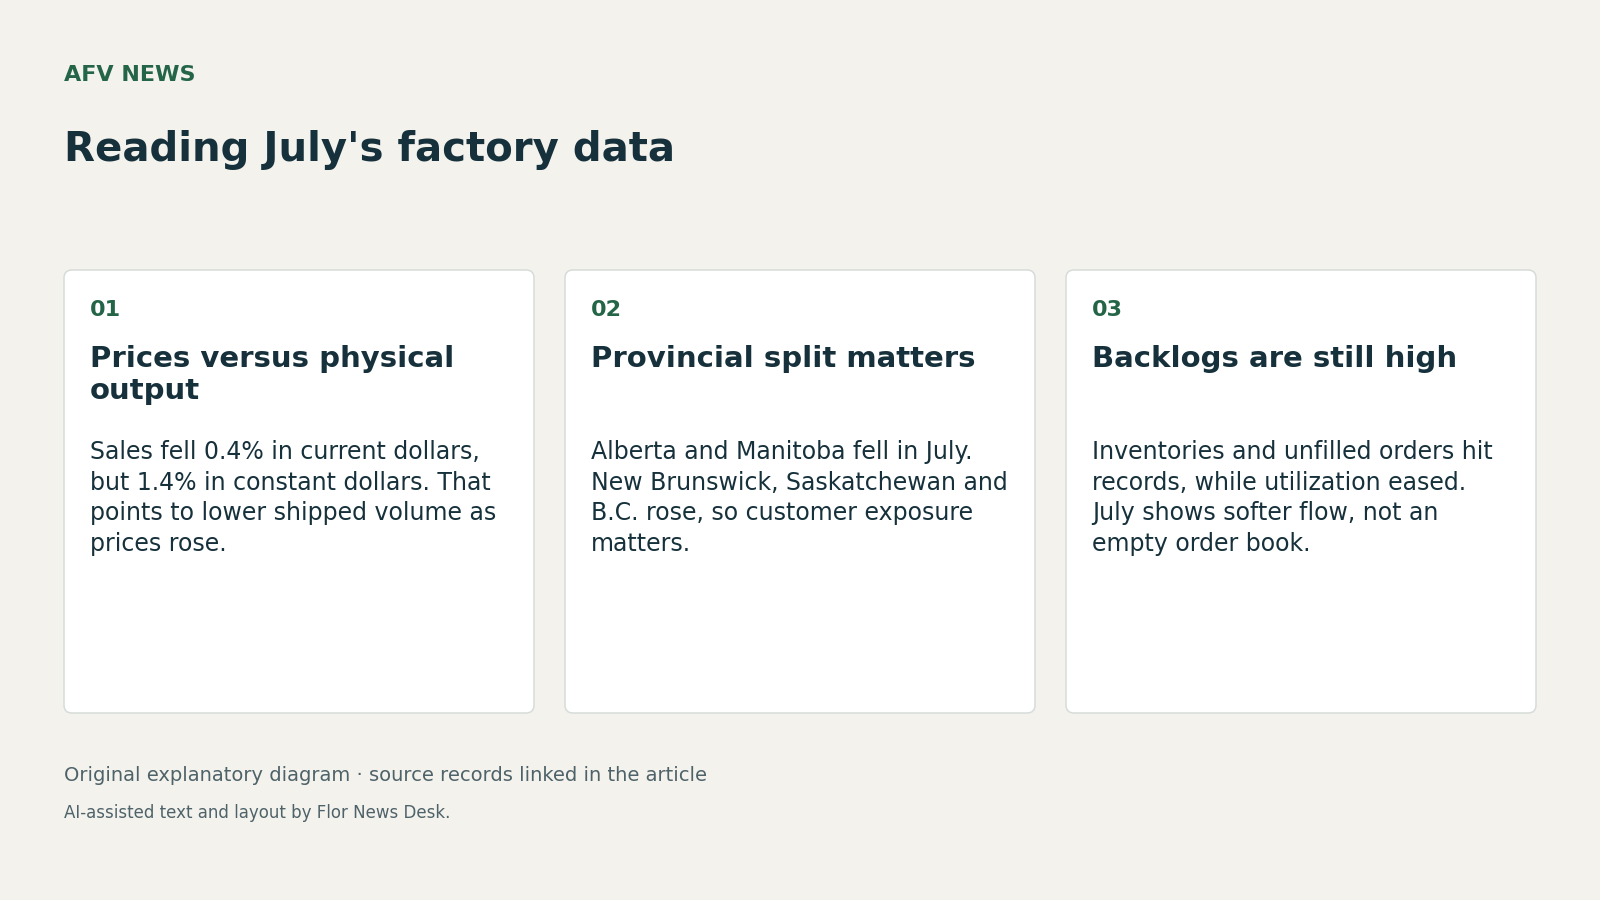
Canadian manufacturers booked $78.7 billion in sales in July 2026, down 0.4% from June, but the sharper signal is the split underneath that headline: Statistics Canada said constant-dollar sales fell 1.4% while the Industrial Product Price Index rose 0.6% Statistics Canada release. For businesses, that means July’s revenue held up better than physical output did. It does not prove margins worsened, because the release does not report company costs or profits, but it does show that price effects buffered nominal sales.
That distinction matters more than the annual comparison. Statistics Canada reported July sales were 10.9% above July 2025, yet the same release shows a month in which dollar sales, real sales and factory-gate prices moved in different directions Statistics Canada release. A manufacturer deciding whether to add shifts or buy equipment would read that as a warning against treating revenue growth alone as demand strength. July’s data support a narrower conclusion: the sector sold less in volume terms even as prices rose.
The industry detail also argues against one broad national story. Statistics Canada said sales fell in 8 of 21 subsectors, with chemical products down 6.6% to $5.9 billion and food down 1.4% to $13.9 billion, while petroleum and coal products rose 1.9% to $10.4 billion Statistics Canada release. That mix suggests July’s decline was not a uniform pullback. Plants tied to chemicals or packaged foods faced a different month from refiners and related suppliers. The record does not establish why each subsector moved, so the practical takeaway is portfolio exposure, not a single macro explanation.
The provincial table reinforces that point. Alberta manufacturing sales were $10.428 billion in July, down 2.7% from June, and Manitoba fell 7.7% to $2.380 billion. New Brunswick rose 14.4% to $2.431 billion, Saskatchewan gained 6.4% to $2.285 billion, and British Columbia increased 1.5% to $6.077 billion provincial table. For suppliers, those splits matter more than the national average when setting sales priorities or staffing plans. The table shows where activity changed, but not whether the move came from volume, prices or a few large plants.
July’s balance-sheet signals were mixed rather than outright weak. Statistics Canada reported total inventories rose 0.3% to a record $127.5 billion, the inventory-to-sales ratio edged up to 1.62 from 1.61, and unfilled orders increased 1.9% to a record $134.6 billion Statistics Canada release. At the same time, the total manufacturing capacity utilization rate fell to 80.7% from 82.2%, on a not seasonally adjusted basis Statistics Canada release. Read together, those figures suggest softer current flow through plants, but not an empty pipeline. Backlogs and stocks are still elevated.
The evidence also has clear limits. Statistics Canada says July 2026 includes preliminary estimates and the previous three months are subject to revision Statistics Canada release. The catalogue page identifies this as monthly dataset 16-10-0048, released on September 14, 2026, and notes earlier corrections affecting older periods; its October 12 modification date does not by itself create a newer July result dataset catalogue. So the useful conclusion for Canadian businesses is specific, not sweeping: July points to a price-supported sales total masking weaker real shipments, with provincial and industry exposure likely to matter more than the national headline.
Read our editorial standards or send a correction to the editorial desk.